Go to Monitoring > Dashboards to create a new dashboard or open an existing one.
The Advanced subscription plan includes unlimited dashboards. The Basic subscription includes only one dashboard.
Add widgets with charts
As soon as you open your dashboard, you can start adding charts presenting various metrics. Click the Add new widget button to start adding widgets with charts. You need to start with selecting a widget type, and then you'll be able to customize the chart and its data source. There are a number of predefined metrics you can use with a widget. You can find out more about widgets in this article.
Dashboard customization
Widget arrangement and size
If you have some widgets on your dashboard already, you may rearrange and resize them freely. Simply drag and drop widgets to change the location. Similarly, click on a widget edge to resize it (horizontally and vertically):
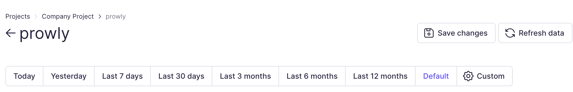
Date range
By default, a widget will display data according to the date range set during its configuration. However, you can use the date range controls on your dashboard to make all widgets display data according to this setting (the widget's default date range will be overwritten):
Export statistics
You can also export statistics presented in your widgets to CSV or XLSX. Simply click on the three-dot button in the top-right corner of a widget and use the Export to ... feature.
If you want to export the whole dashboard, click the "Download" button at the top and choose PDF or JPEG format.