Create a new report
In order to create a PR report, click on Reporting > Reports in our navigation menu to start.
Firstly, you'll be asked to create a brand for which you'll be able to create reports. Brands are useful if you operate as an agency and have multiple clients for whom you'll be creating reports. You can have one for each one of your clients, and this way you can keep your reports organized. Alternatively, you can just put your company name here.
As soon as this is done, you can go ahead and start building your report - click the Create first report button or click on the brand name and then use the Create new report button. Before you start working on your report, it's recommended to go through brand settings. You can read more about it in this article.
Report editor
You can add multiple pages to your report but there can be only one home page.
Home page
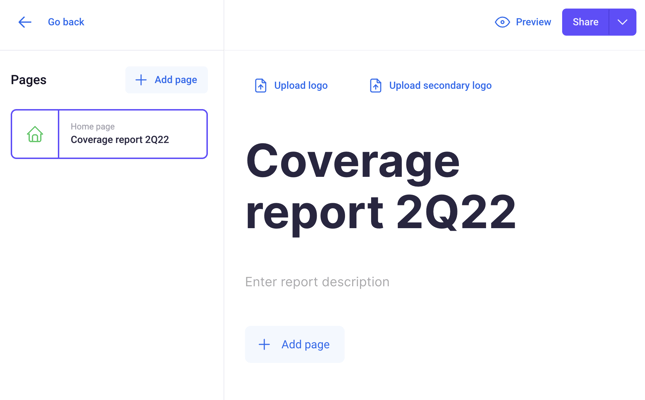
When you create a new report, you're going to see the home page of your new report. You can customize the title and description, you can upload logos (you can add two - i.e. yours and your client's) and if you've added any logos in brand settings, they will be added to the report automatically. Finally, you can add other pages to the report by clicking the Add page button. There will be several types of pages to choose from (described below). As soon as you add other pages to the report, they will be included in a form of a summary on the title page as well. home
Coverage page
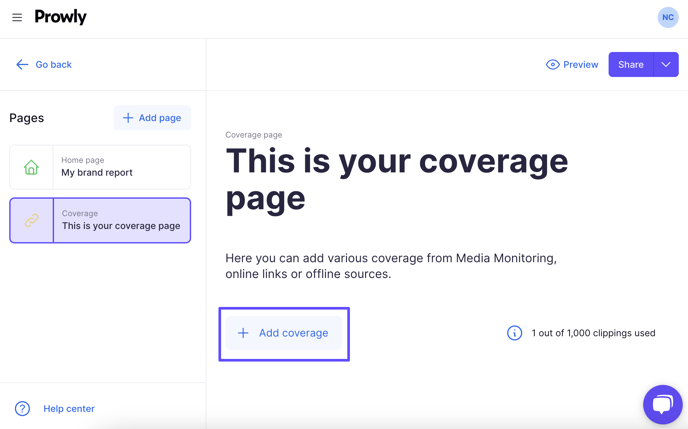
This page is to present the entire or just the most important coverage achieved through PR activities. To start, click the "Add coverage" button.
Next, you can choose one of three ways to add coverage to the report:
- Add clippings from URLs - choose this option to manually paste links to online articles and social media posts (e.g. TikTok, Facebook, YouTube videos). You can also import links from an XLS or XLSX file.
- Add mentions from Media Monitoring - automate the process by linking the report with the Media Monitoring module and mentions you have gathered there. Read more about how to add and filter out the mentions in the paragraph below.
- Upload offline coverage - attach anything from a magazine feature or journal report to a newspaper article. When adding the coverage, you can also include an image of the article in JPG, PNG, and PDF files.
If there's any coverage you'd like to highlight, we recommend adding at least two coverage pages. The first one with the most important coverage, and the other with the remaining relevant coverage. You can add the same clippings on many pages.
You can also tag the clippings you add to your Coverage page. To do so, simply click on the three dots in the right-upper corner of the clipping and choose "Add tags". You can manage your tags by going to the cogwheel icon in the right-upper corner of the app and clicking on "Manage tags". More information on tags can be found in this article.
There's a limit to how many new clippings you add. The limit depends on your PR Reports subscription plan, and the limits reset every month.
Media Monitoring mentions in the Coverage page
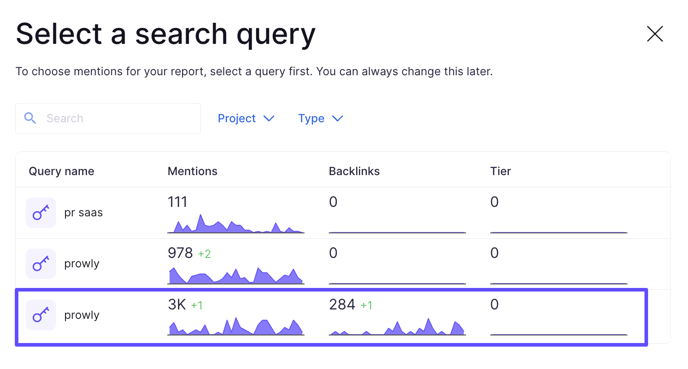
Adding Media Monitoring mentions to a report efficiencies your work, saves time and allows you to categorize your coverage easily and quickly. Choose the "Add mentions from Media Monitoring" option when adding coverage. Next, choose a query you'd like to import the mentions from:
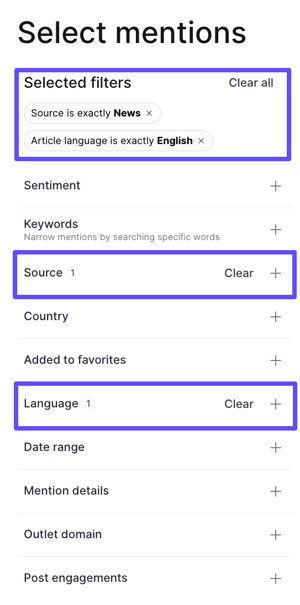
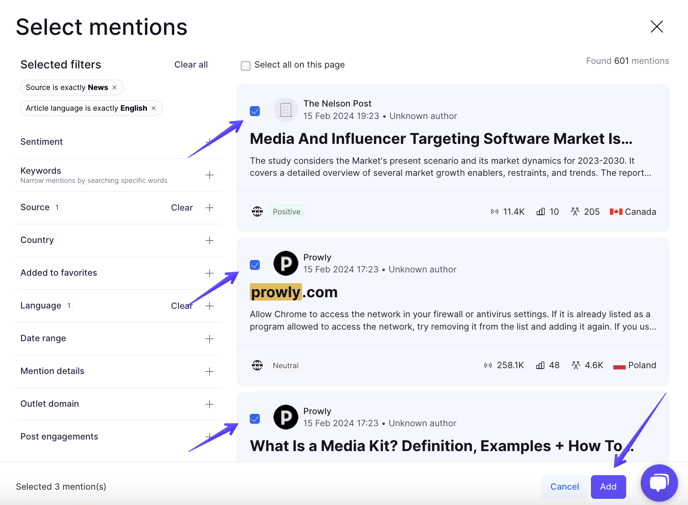
Once you have chosen a query, you can then decide which mentions you'd like to include in the coverage. You can filter the results however you want using our built-in filters. For example, if you want to include only mentions that are in English and are from "News" source on this particular coverage page, choose the below filters:
 An interesting approach when creating a PR Report is adding designated coverage pages for different types of mentions. For example, on the first coverage page, you can include mentions from news, articles and blogs; on the second page, you can add mentions from social media. Feel free to play around with the filters and options to find a way that suits your PR needs the best!
Once you have set your mind on the filters, mark all the mentions you want to add with a tick and click the "Add" button at the end.
How are PR Reports and Media Monitoring integrated?
PR Reports and Media Monitoring integration extends into the creation of coverage pages -- both online and offline coverage. With offline coverage, this enables you to add author names and media outlets that are searched directly from our database.
Because PR Reports and Media Monitoring are integrated, you can add mentions from the Media Monitoring module directly into the report without copying and pasting links.
Metrics page
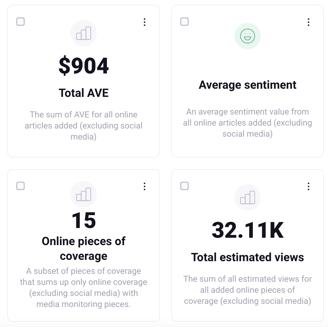
This page allows you to present various charts and metrics on articles and social media content. The metrics you can add to present the included coverage visually are:
- Online pieces of coverage
- Offline pieces of coverage
- Total estimated views
- Average sentiment
- Average domain authority
- Total AVE
- Total number of backlinks
They are calculated automatically by our algorithms used in Media Monitoring and you can read more about the metrics in this article.
For social media content, the metric widgets let you display a total number of links or a total for each one of the supported social media platforms: Instagram, LinkedIn, Facebook, YouTube, and TikTok.
You can also add custom metrics that may store any additional metrics you may need for your reports. You can give it any name you wish and make it show any number you need i.e. webinar attendees, budget spent, or expert comments placed.
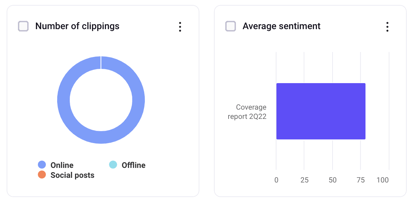
The other form of visual representation of your coverage is through charts. You can build charts presenting the same kind of data as with metrics. The difference is that you can present the data on several types of charts with an optional breakdown dimension. Supported types of charts:
- Bar
- Column
- Donut
- Line
Performance page
This page gives you a way to display statistics of your email pitches. There are two approaches you can take to display email statistics. First of all, you can select multiple emails from your account and the statistics displayed on the Performance page are going to be averaged out. The second approach is to just select one email per page, and this way you're going to be able to show statistics of individual emails.
Customise metric widgets
All of the widgets you add to the Metrics and Performance pages are, by default, calculated by our algorithms. However, if you need to overwrite the values with your own, simply edit a widget by using the Edit option under the dotted menu in the corner:
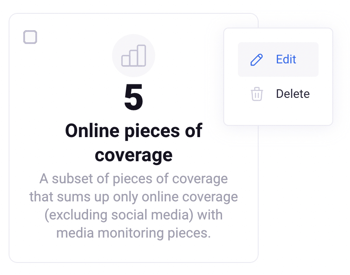 You can overwrite the value and then update the title and description of the widget. You can always restore the default values that have been overwritten.
Publish and share your report
When your report is ready, you can share it with selected recipients in the desired format. Click the Share button in the top-right corner to proceed.
You can choose if you would like to publish your report online under a dedicated URL (no Prowly branding) or generate and download a file in an Excel, PDF, or PPT format.
Should you choose to publish it online, your report can be password-protected if necessary. If you use the link after the report is published, you're going to get the report which can be easily turned into a presentation (using the Slideshow option).
Once you publish your report online, the files (PPT, PDF, and Excel) will be also generated automatically and will be made available for you to download.
Finally, you can also share your report via email. Click on the right side of the Share button to access the Send via email feature. You can send it to 5 recipients at a time and the email is going to include some general information and metrics from the report.