Email authentication changes coming in February 2024
There’s a crucial update coming our way in February 2024 from Gmail and Yahoo! regarding email authentication. From this time, both companies have required bulk senders to authenticate their email domains.
This means that starting February 2024, it is mandatory to authenticate your domain in Prowly in order to continue sending emails through our platform.
For detailed instructions on how to authenticate your domain in Prowly, please refer to our Help Center article.
After you’ve sent your email pitches through Prowly, you can start tracking results—including engagement, delivery, recipients statuses and replies. You can observe the separate statistics of a given sendout or the overall analytics of your mailings.
Mailing analytics
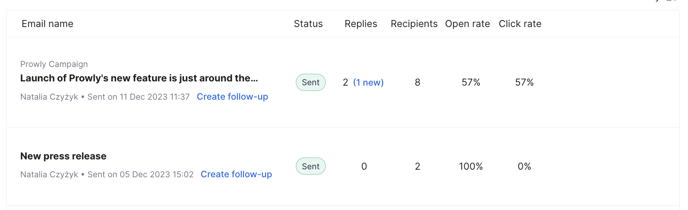
To see mailing analytics for a given send out, go to the Emails module and choose a mailing you'd like to analyse by clicking on it:
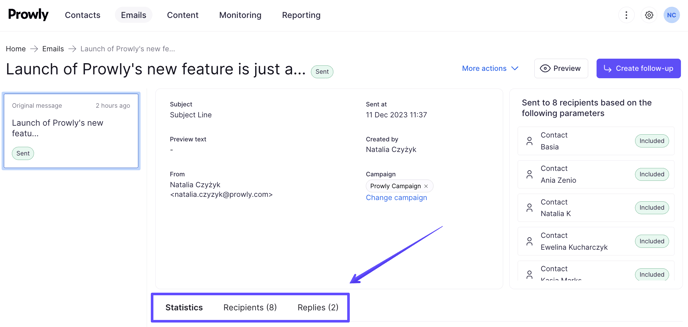
Here, you can see the overview of your message with its most important elements, such as the subject line, sent date or the assigned campaign. Detailed analytics are available below this screen. Scroll down and choose from the Statistics, Recipients and Replies tabs:
Statistics
Under the default Statistics tab, you can access information about email engagement and delivery.
Engagement
In this section, you can see various metrics that track and describe overall audience engagement with your mailing:
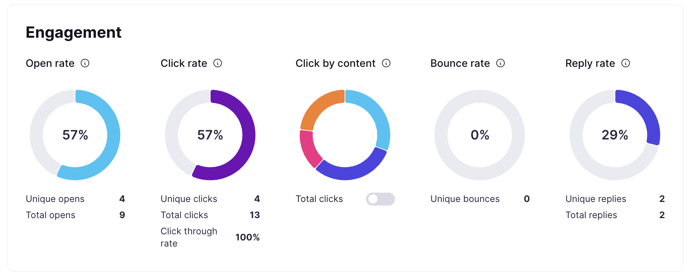
Open rate
Open rate is the percentage of recipients who have opened the email pitch at least once out of the recipients who got your message. The calculation formula is as follows:
Open rate = Unique opens / Delivered emails
Unique opens show you how many recipients opened your email pitch.
Total opens show you how many times your email was opened in total. If a single recipient opens your email twice, it's going to be reflected as one unique open but two total opens.
Both Unique opens and Open rates give you a good sense of the overall engagement with a specific email pitch and show you whether your subject lines are encouraging enough for the recipients to click on them.
Check out our Prowly Magazine article for more tips on how to increase open rates of your emails. Think of this short guide as a roadmap of what to do and what to check after you send the email.
To prevent your metrics from being skewed by mailboxes' security bots opening the email even before it reaches the recipient, you can turn on adjusted open rates. Learn more about how they work in this article.
Click rate
Click rate is the percentage of people who clicked on a link in your email out of the people who received your email pitch. The calculation formula is as follows:
Click rate = Unique clicks / Delivered emails
While Opens help you measure how many recipients opened your email pitch and at least looked at it, Total clicks measure how many times the links in your email were clicked. Similar to unique opens, unique clicks are counted as only one per recipient, while total clicks may include several clicks from a single recipient.
Click through rate is the percentage of people who clicked a link in your email out of the people who opened your email pitch. The calculation formula is as follows:
Click through rate = Unique clicks / Unique opens
Clicks are quite important because they help you measure how effective your email pitches are when it comes to convincing the email recipients to take action (i.e. see a specific press release or visit a newsroom).
If you notice lots of opens but not as many clicks, you might want to experiment with email content, formatting, and your call-to-action.
To prevent your metrics from being skewed by mailboxes' security bots clicking the email even before it reaches the recipient, you can turn on adjusted click rates. Learn more about how they work in this article.
Click by content
Click by content allows you to see the breakdown of different types of links that were included in the mailing and how many unique clicks were there for each of these types. Types of links include press release, CTA (call-to-action button), attachment, other (i.e. a regular link) and the unsubscribed button. To check the rates, simply hover your mouse over the different colors on the donut chart.
If you mark the Total clicks toggle, you will see the number of total clicks per each type of link, so they may include several clicks from one recipient.
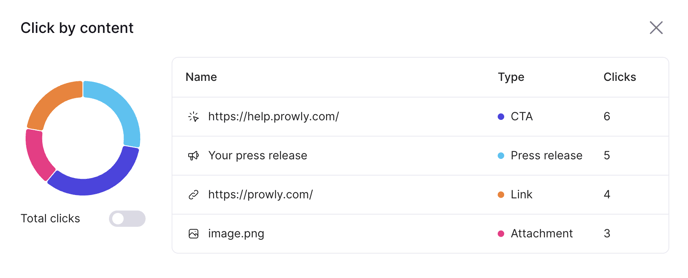
To see more detailed information, click on the "View clicks by content" button. This will open a pop-up window, where you can see which exact elements were clicked and how many times. We show unique clicks by default, but you can always switch to summarised ones by marking "total clicks".
Bounce rate
Bounce rate shows the percentage of emails that couldn't be delivered out of all sent emails.
Bounce rate = Bounced emails / All sent emails
There are also many reasons why an email to a specific recipient might bounce, including their email address being non-existent, blocked, or their mailbox being full. More detailed information about the types of bounces can be found in the Delivery section of the email statistics.
Reply rate
Reply rate shows the percentage of recipients that replied to your email out of all emails that were delivered (not bounced).
Reply rate = Recipients who replied / All delivered emails
To collect replies in Prowly, you first need to connect your inbox. For more details and insights regarding replies, click on the Replies tab.
Email viewing time
In this section, you can see how much time your recipients spent on viewing your email in a percentage breakdown of all recipients who opened it:
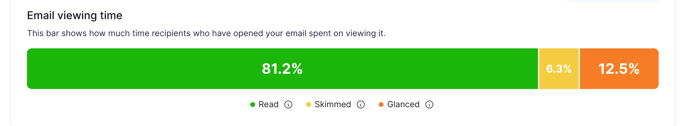
The available ranges are Read (at least 15 seconds), Skimmed (3 to 15 seconds) and Glanced (less than 3 seconds).
This feature is only accessible for Pro subscriptions that have their domain authenticated.
Delivery
In this section, you can see a detailed breakdown of your mailing engagement. Take notice that this data is based only on the unique opens and clicks, so the total statistics might vary.
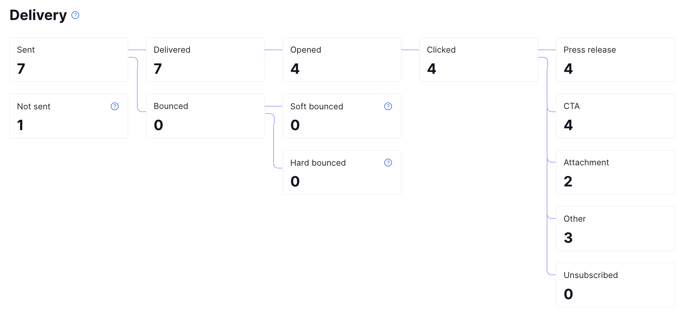
The first segment allows you to see how many emails were sent (in this case, 7 emails) and how many were not sent (1 email). If an email is not sent to a recipient, it's most likely due to them being blacklisted or blocked, and such emails are not counted towards your monthly email limit!
Next, you can see how many of these emails were delivered (7 emails) and how many bounced (0 emails). If there would be some bounced emails, you could then check how many were soft bounces (email reached the recipient, but their mailbox was full or the server was down) and how many were hard bounces (permanently rejected emails that won't be delivered to protect sender's reputation). Soft bounces are temporary, so there's a chance that by the next sendout, the email will be delivered to these recipients successfully.
Out of 7 delivered emails, 4 of them were opened and all of these opened emails were clicked (4 emails). The last column shows how many times specific types of links were uniquely clicked (4 recipients clicked on a press release link, 2 clicked on the attachment etc.)
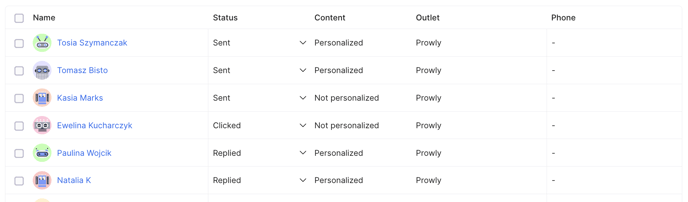
Recipients
To see the detailed information about each of your contacts, click on the Recipients tab. It shows a list of your contacts alongside their delivery status, personalization and contact information.
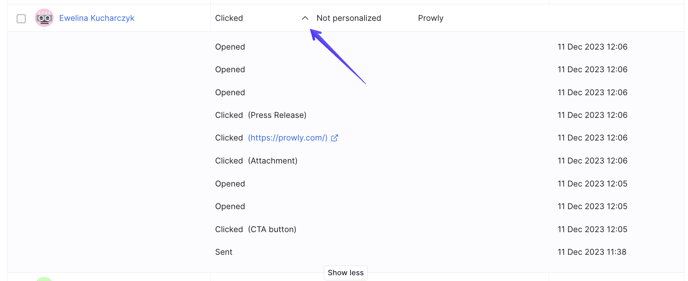
To see the detailed delivery path for each recipient, click the arrow next to their status and the "Show more" button at the bottom. The email actions are listed chronologically, starting from the bottom and progressing to the top.
Detailed recipient statuses are only accessible for Pro subscriptions.
Replies
If you connect your inbox, you will be able to receive and see replies to your mailings sent via Prowly. Check this Help Center article to learn more.
After connecting inbox, sending out a mailing and receiving replies, you can see them in this tab:
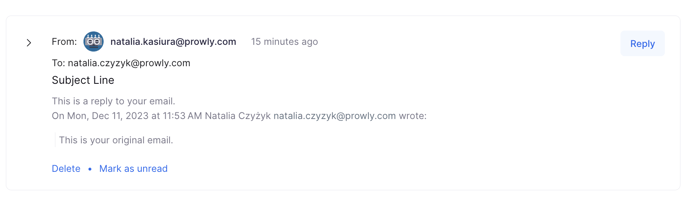
You can delete each message, mark it as unread or reply to it.
Replies are also visible on the contact cards. Access them by simply clicking on the names of the contacts in the Recipients tab.
General emails analytics
To see the overall analytics of all your mailings, go to the Emails module and click on the "Analytics" tab:

By default, the results in the Analytics section are shown for all mailings sent within the last 30 days. However, you can freely modify the filters to include a broader or narrower chunk of your mailings in the metrics. To do so, go through the filters on the left side of the screen.
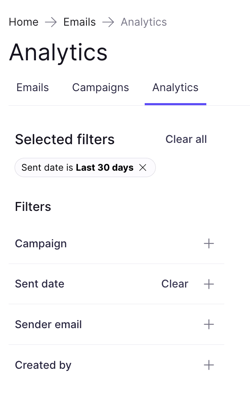 Available filters are:
- Campaign - show mailings only from one selected campaign. If you want to see all mailings again, remove this filter by clicking "Clear".
- Sent date - filter mailings by their sent date.
- Sender name - filter mailings by their sender.
- Created by - filter mailings by the people who created them.
Once you have chosen the desired filters, you can scroll through the main part of the tab and gather all the valuable insights from your mailings.
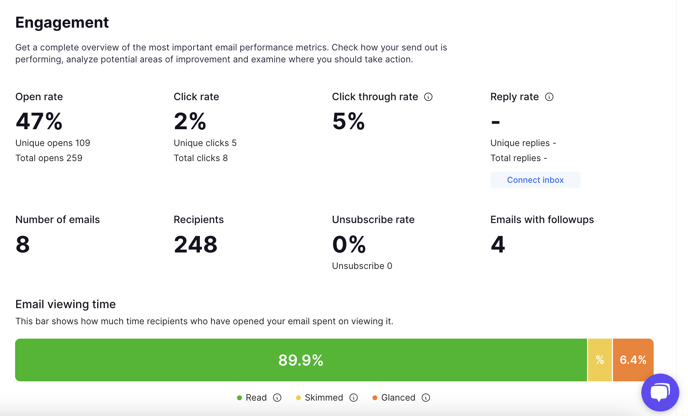
The Engagement section gives you an overview of the most important metrics of your mailings and their overall performance. You'll find open, click, click through and reply rates here, alongside the total number of emails sent, number of recipients, followups and percentage of unsubscribed contacts. At the bottom, you can access the email viewing time graph to see the breakdown of time recipients spent viewing your email.
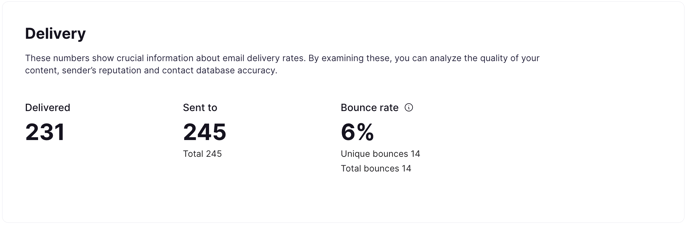
Next, in the Delivery section, you can quickly see how many mailings were sent overall, how many of them were successfully delivered and how many bounced, including what was the total bounce rate.
Scroll down to analyse the Email performance chart. It categorizes your mailings (the dots seen on the chart), visualizing their performance against the average open rate on the x-axis and the average click rate on the y-axis. This graph can help you determine which mailings performed better than the rest and why.
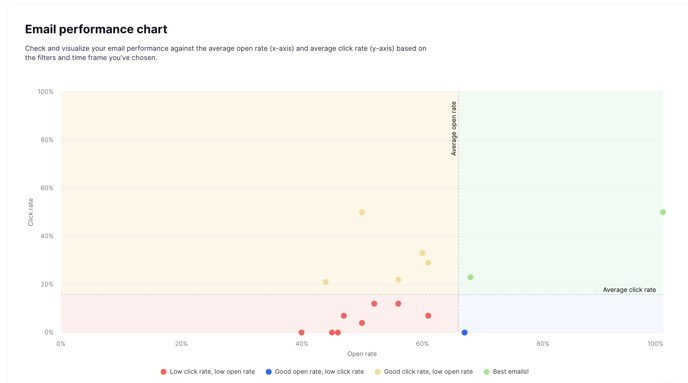
Hover your mouse over the dots to see the details of the mailings. The best emails, marked with green dots, are those with open and click rates above the average.
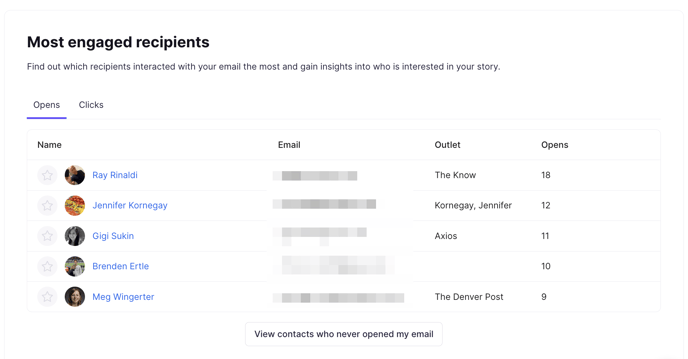
The last section is dedicated to the Most engaged recipients. You can analyse a list of contacts who often open your mailings. Moreover, you can see the recipients who don't interact at all by clicking the button below.
What else should you know about email pitch analytics?
- Depending on the email service provider, you might have access to different metrics. Keep in mind that not every provider calculates all these metrics the same way!
- Some email pitches will perform better than others. Depending on your relationship with the recipients and their areas of interest, you will most likely see different results from different email pitches. That’s precisely why you should segment your media list and tailor email pitches to specific recipients.
- Don’t be so hard on yourself. Average open and click rates will vary from one PR outreach campaign to another, and some of them will be satisfactory even if they don’t seem like it at first. According to industry leaders, the open rate of email send-outs is around 20%
Take into account that assessing the effectiveness of your PR efforts based on the results of one mailing is practically impossible. Use the insights found in Prowly to optimise your email pitches and plan your PR outreach accordingly.